
Figure 6.
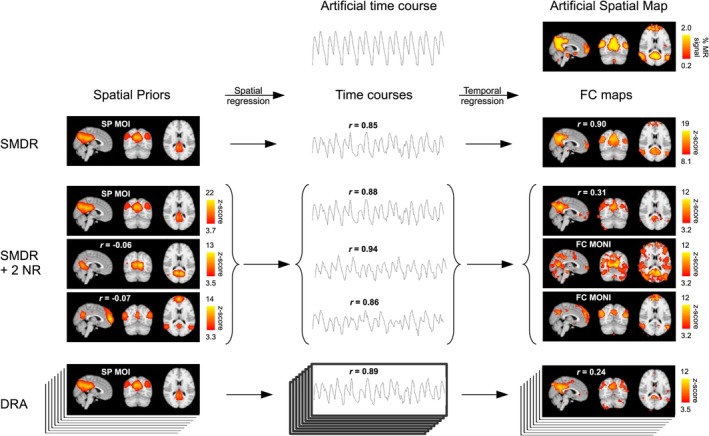
Experiment 1: Example of decreased FC map quality after including two (SMDR + 2 NR) or all (DRA) NR in dual regression. The time courses for two NR used in DRA for a subject correlated highly with the artificial time course; and the addition of the corresponding spatial prior regressors to SMDR reduced the CC quality score from 0.90 to 0.31. Portions of the artificial spatial map (showing where artificial signal was added) appeared to be contained within the FC MONI. Inclusion of all NR further reduced CC (0.24). Arrows represent regression, spatial or temporal, onto the session's fMRI data. Pearson correlation coefficients (r) show correlations with the top spatial map or time course in each column: SP MOI, artificial time course, or the artificial spatial map. Spatial maps were visualized with lower thresholds set (a) for spatial priors, with group ICA (FSL MELODIC) alternative hypothesis test at p > .95; (b) for the artificial spatial map, at 1/10 of maximum artificial signal amplitude; and (c) for the FC maps, at a z‐score where # false positive = # false negative voxels, defining true “activation” with the binary map that had been spatially blurred to create the artificial spatial map. All shown sagittal, coronal, and axial brain slices intersect at MNI coordinates [3, −63, 15]. FC, functional connectivity; FC MONI, FC maps of no interest; ICA, independent component analysis; MELODIC, Multivariate Exploratory Linear Decomposition into Independent Components; MNI, Montreal Neurological Institute; NR, nuisance regressors; SMDR, single‐map dual regression; SP MOI, spatial prior map of interest [Color figure can be viewed at http://wileyonlinelibrary.com]