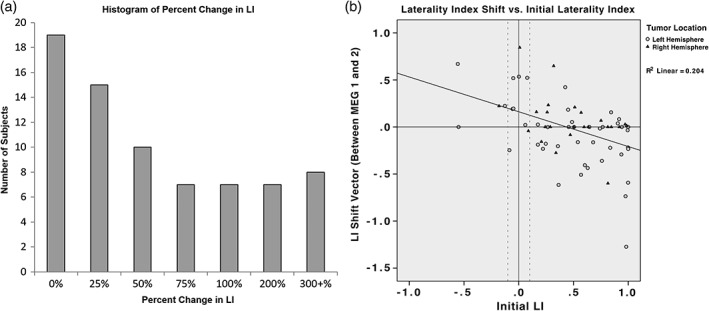
Figure 4.

(a) Histogram of percent change in LI. Patients are grouped according to their percent change in LI, defined as the absolute value of the change in LI divided by the initial LI. Patients are binned by quartiles from 0% to 100%, then by 100% increments up to 300%, and finally by 300+%. (b) Association between laterality shifts and initial laterality presentation. Patients with increasing left LI values shift more rightward, and patients with increasing right LI values shift leftward. There is an association between greater initial left lateralization and increasing rightwards LI shift, and vice versa. Points are grouped based on tumor location. Positive values indicate left hemispheric initial position (horizontal axis) and leftward LI movement between scans (vertical axis). Negative values represent right hemispheric initial position (horizontal axis) and rightward LI movement between scans (vertical axis)
