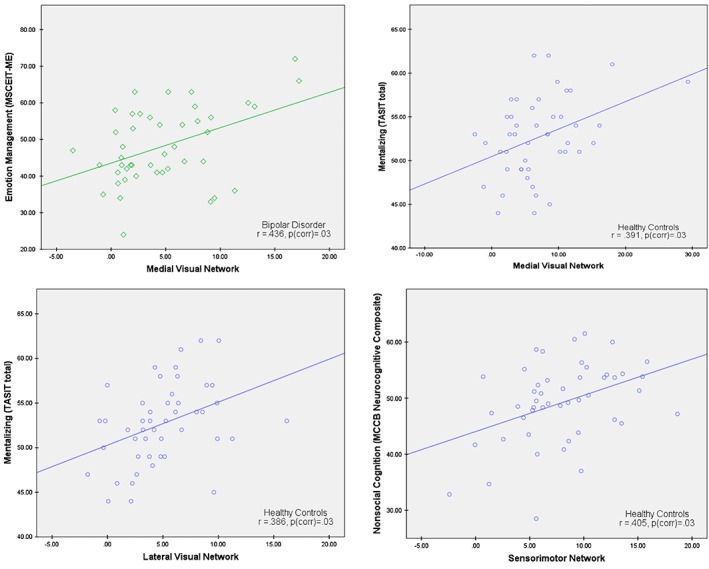
Figure 2.

Scatter plots depicting significant within‐group correlations (corrected for multiple comparisons) between functional connectivity within the medial visual network (MVN), lateral visual network (LVN), and sensorimotor network, and the behavioral measures of social and nonsocial cognition [Color figure can be viewed at http://wileyonlinelibrary.com]
