
Figure 2.
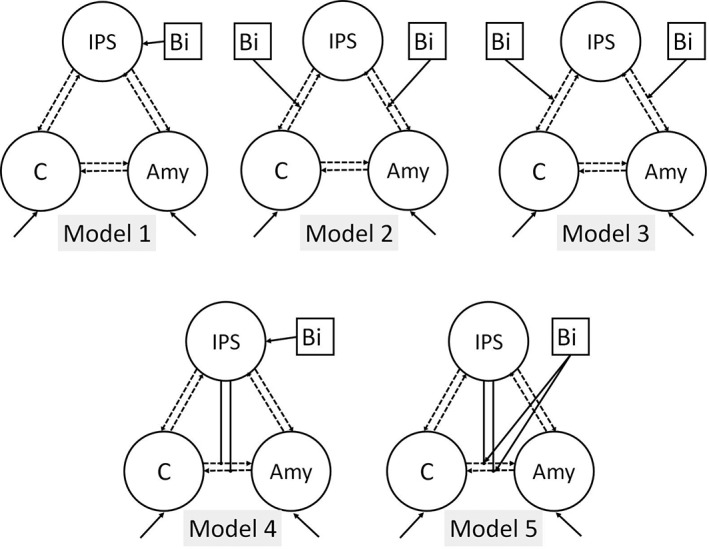
DCM model space for the olfactory–visual integration. The model space for auditory–visual integration was identical, with the amygdala being replaced by the SG. Endogenous, modulatory, and direct effects as well as nonlinear modulatory effect (A‐, B‐, C‐, and D‐matrix, respectively) are shown. Self‐connections are not depicted in the model space. Amy, amygdala; bi = bimodal stimulation; C, cuneus; DCM, dynamic causal modeling; IPS, inferior parietal sulcus; STG, superior temporal gyrus