
Figure 3.
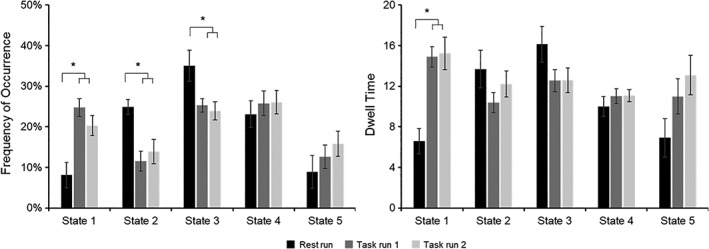
Frequency of occurrence and dwell time for each state for resting state and task, with the first three states showing a significant difference in frequency between rest run and task runs and State 1 showing also a significant difference in dwell time between rest run and task runs. Error bars present standard error of the mean