
Figure 2.
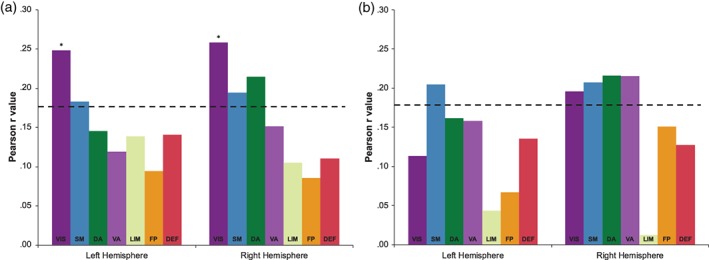
(a,b) Pearson r values correlating sustained attention and network cortical thickness (a: gradCPT; b: TOVA). Each bar represents a different network (DA, dorsal attention; DEF, default; FP, frontoparietal; LIM, limbic; SM, somatomotor; VA, ventral attention; VIS, visual). The left cluster of bars are correlations with left hemisphere networks and the right cluster of bars are correlations with the right hemisphere networks. The dotted line represents the critical r value at an alpha level of p = .05, (gradCPT N = 125: r = .176; TOVA N = 121: r = .179). The asterisk represents a correlation that was significant after FDR correction at an alpha level of q = 0.05 after correcting for multiple comparisons. All correlations are corrected for age, PTSD, mild TBI, and estimated IQ (see Section 2) [Color figure can be viewed at http://wileyonlinelibrary.com]