
Figure 6.
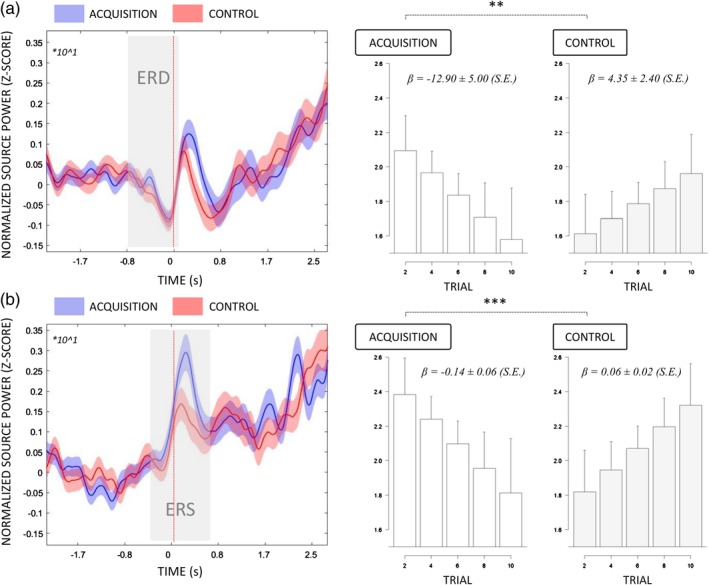
A. Averaged time‐course of source alpha power (8–12 Hz) in BA7 (left panel) exhibiting an ERD from −0.50 s to −0.10 s (gray shades) relative to the onset of load‐lifting. Blue and red shades correspond to CI95%. EXPERIMENTAL CONDITION by TRIAL interaction effect (fitted estimates) on the BA7 ERD amplitudes (right panel). Regression slopes are represented with CI95% (dotted lines). B. Averaged time‐course of source alpha power (8–12 Hz) in BA10 (left panel) exhibiting an ERS from −0.30 s to 0.35 s (gray shades) relative to the onset of load‐lifting. Blue and red shades correspond to CI95%. EXPERIMENTAL CONDITION by TRIAL interaction effect (fitted estimates) on the BA10 ERS amplitudes (right panel). Regression slopes are represented with CI95% (dotted lines) [Color figure can be viewed at http://wileyonlinelibrary.com]