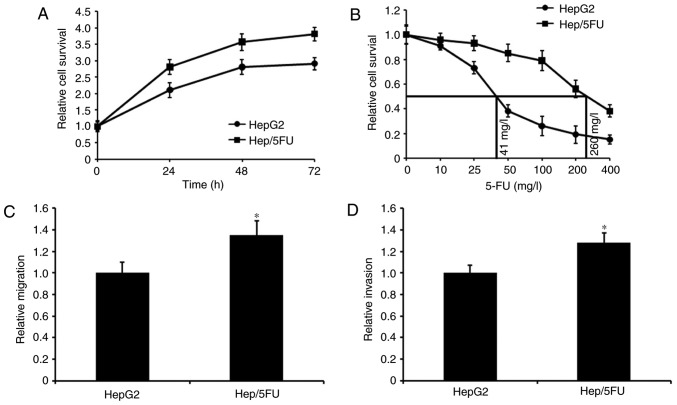
Figure 1.
Characterization of Hep/5FU and HepG2 cells. (A) Cells were maintained in 96-well plates and cell proliferation was assessed with an MTT assay at the indicated time intervals. Growth curves of the two cell lines were generated. (B) Cells were incubated in 100 µl DMEM for 24 h and treated with 0, 10, 25, 50, 100, 200 or 400 mg/l 5-FU for 48 h. Cell proliferation was evaluated with an MTT assay. Maximal half inhibitory concentration values of 5-FU for the two cell lines were calculated. (C) Hep/5FU and HepG2 cells were seeded into the upper chamber for migration assays. (D) For invasion assays the upper face of the membrane of chamber was covered with 70 µl Matrigel (1 mg/ml) prior to Hep/5FU and HepG2 cells being added. Following incubation, cell migration and invasion were evaluated. Migration and invasion were calculated relative to that of HepG2 cells. *P<0.05 vs. HepG2 cells. Data are presented as the mean ± standard error of the mean of three independent experiments. Hep/5FU, 5-fluorouracil-resistant HepG2.

