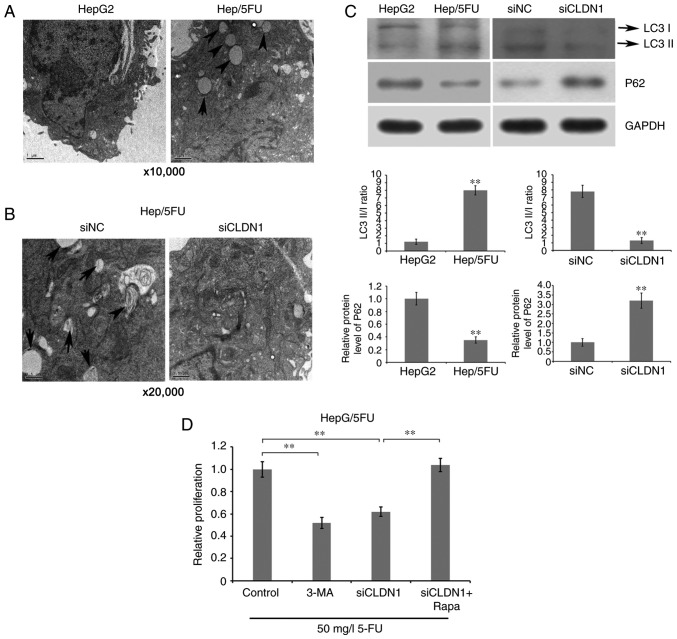
Figure 4.
Association between autophagy and drug resistance of Hep/5FU cells. (A) HepG2 and Hep/5FU cells were cultured to 80% confluence and autophagy was detected. The ultrastructures of cells undergoing autophagy were observed and imaged using TEM. Magnification, ×10,000. Black arrows indicate autophagosomes. (B) Autophagy of Hep/5FU cells transfected with siNC or siCLDN1 was observed using TEM. Magnification, ×20,000. Black arrows indicate autophagosomes. (C) Protein expression levels of LC3 I/II and P62 in HepG2 and Hep/5FU cells, as well as Hep/5FU cells transfected with siNC or siCLDN1 were assessed by western blot analysis using the corresponding antibodies. Protein bands were quantified by densitometry and the expression levels were expressed as a ratio relative to the expression level in HepG2 or siNC-transfected cells. **P<0.01 vs. HepG2 cells or siNC-transfected cells. (D) Hep/5FU cells were treated with or without siCLDN1, 5 mM 3-MA or 10 nM Rapa combined with 50 mg/l 5-FU for 48 h, and cell proliferation was detected with an MTT assay. **P<0.01. CLDN1, claudin-1; Hep/5FU, 5-fluorouracil-resistant HepG2; siCLDN1, small interfering RNA targeting claudin-1; TEM, transmission electron microscopy; LC3, microtubule-associated protein 1A/1B-light chain 3; 3-MA, 3-methyladenine; Rapa, Rapamycin; NC, negative control.

