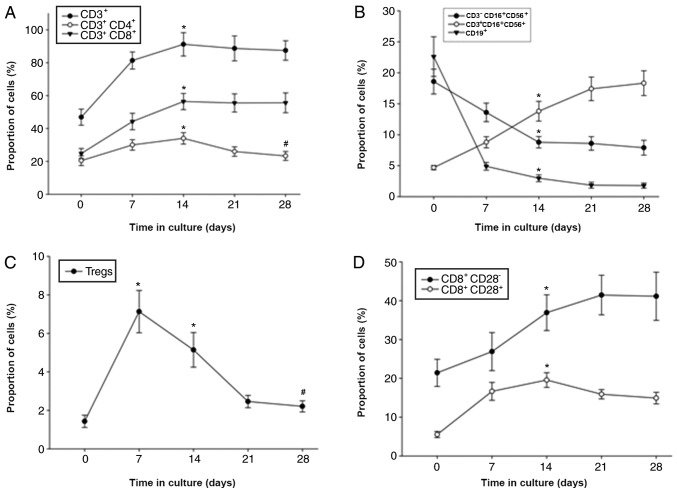
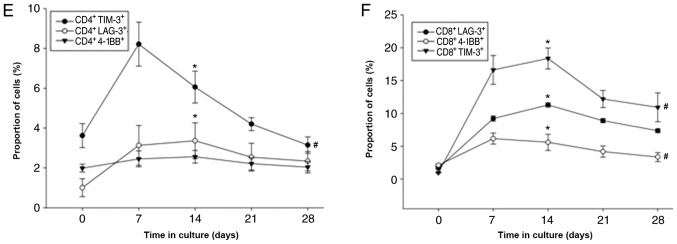
Figure 2.
Measurements of the expanded population percentages of various cytokine-induced killer cell groups during ex vivo culture. Six sub-groups are presented according to T cell subtypes. (A-F) Changes in the proportion of (A) CD3+, CD3+CD4+ and CD3+CD8+; (B) CD3−CD16+CD56+, CD3+CD16+CD56+ and CD19+; (C) Tregs; (D) CD8+CD28− and CD8+CD28+; (E) CD4+TIM-3+, CD4+LAG-3+ and CD4+4-1BB+; and (F) CD8+LAG-3+, CD8+4-1BB+ and CD8+TIM-3+. Multiple subgroup comparisons were performed using ANOVA. *P<0.05 vs. day 0; #P<0.05 vs. day 15. IFN-γ, interferon-γ; TNF-α, tumor necrosis factor-α; IL-2, interleukin-2; LAG-3, lymphocyte-activation gene 3; 4-1BB, tumor necrosis factor receptor superfamily member 9; TIM-3, T cell immunoglobulin and mucin protein 3.


