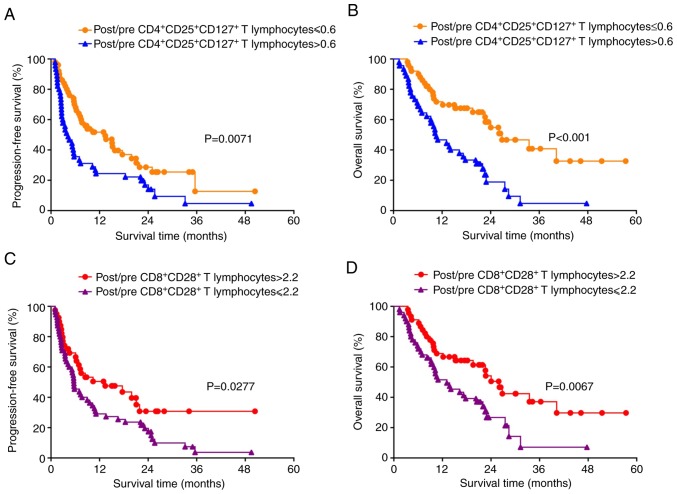
Figure 3.
Survival analysis stratified by different T cell subtypes. Comparison of (A) progression-free survival and (B) overall survival between patients with post/pre-culture CD4+CD25+CD127+ T lymphocyte ratios ≤0.6 and >0.6. Comparison of (C) progression-free survival and (D) overall survival between patients with post/pre CD8+CD28+ T lymphocyte ratio >2.2 and ≤2.2.

