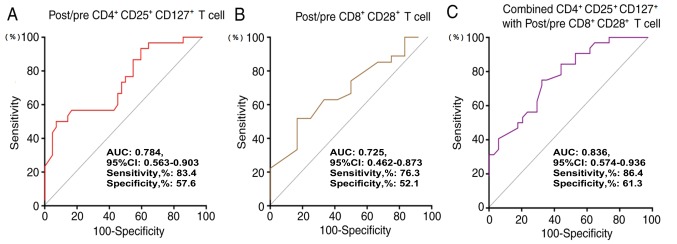
Figure 4.
Receiver operating characteristic curves indicating the prognostic performance of (A) the post/pre CD4+CD25+CD127+ regulatory T cells, (B) the post/pre CD8+CD28+ T cells and (C) the combination of these T cell subtypes. CI, confidence interval; AUC, area under the receiver operating characteristic curve.

