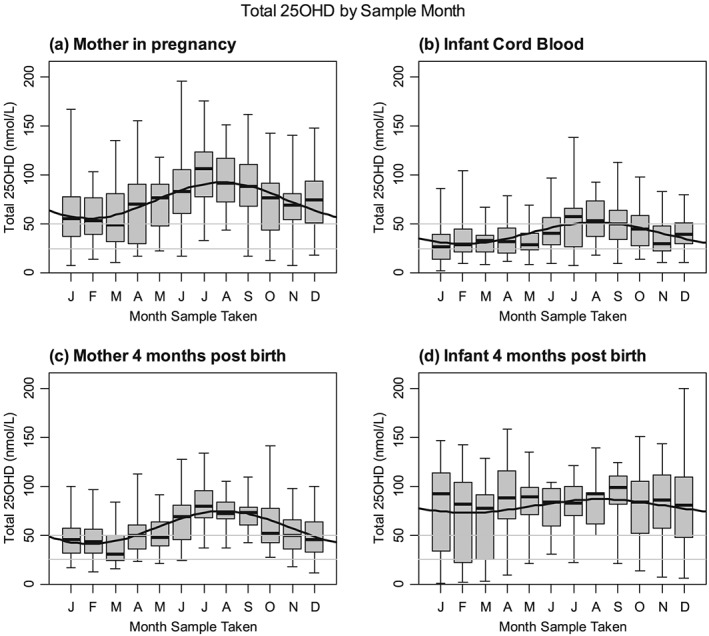
Figure 2.

Vitamin D levels by month. Boxplots show median, interquartile, and absolute ranges for each month. Solid line shows a sinusoidal fit to the data. Horizontal lines show the cut‐offs for insufficient (<50 nmol/L) and deficient (<25 nmol/L) levels
