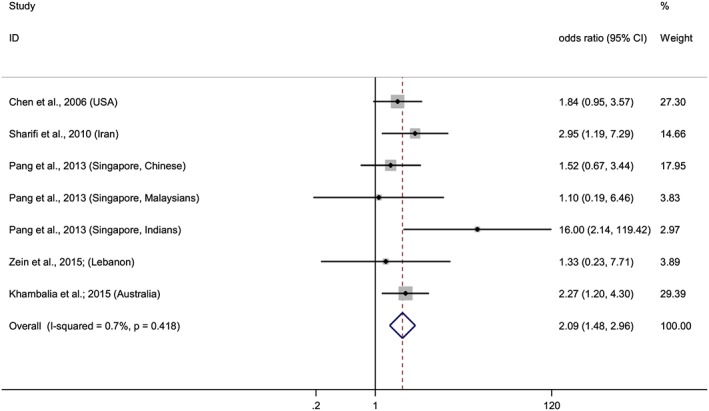
Figure 3.

Forest plot of overall risk of high versus low ferritin levels and the risk of GDM. Squares represent the odds ratio (OR) for each study and the size of the square reflects the study‐specific statistical weight. Horizontal lines indicate the 95% CI of each study. Diamond represents the combined OR estimate with corresponding 95% CI. I‐squared and P‐value inform about heterogeneity among studies
