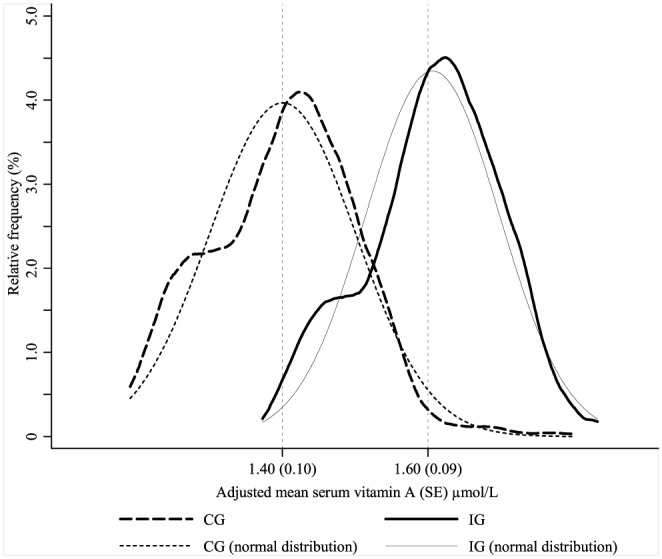
Figure 3.

Relative frequency of serum vitamin A concentrations adjusted for city, primary health center, maternal education, maternal age, and child age in multilevel linear regression analysis (kdensity and normalden STATA procedures) by study groups. CG = control group; IG = intervention group; SE = standard error
