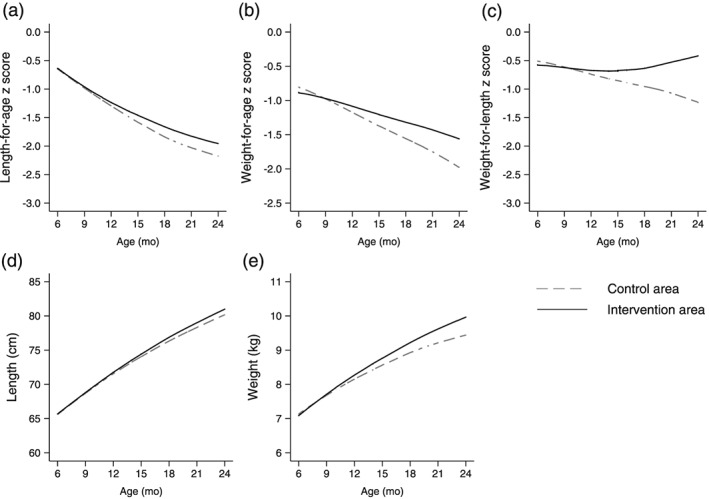
Figure 2.

Predicted length‐for‐age z score (A), weight‐for‐age z score (B), weight‐for‐length z score (C), length (D) and weight (E) of children 6 to 24 months of age in control and intervention areas. The graphs were produced by locally weighted regression on the predicted values derived from linear mixed‐effect regression models including age quadratic term (n = 725 children in control area; n = 750 children in intervention area). The Lowess curves had a bandwith of 0.8.
