
Figure 2.
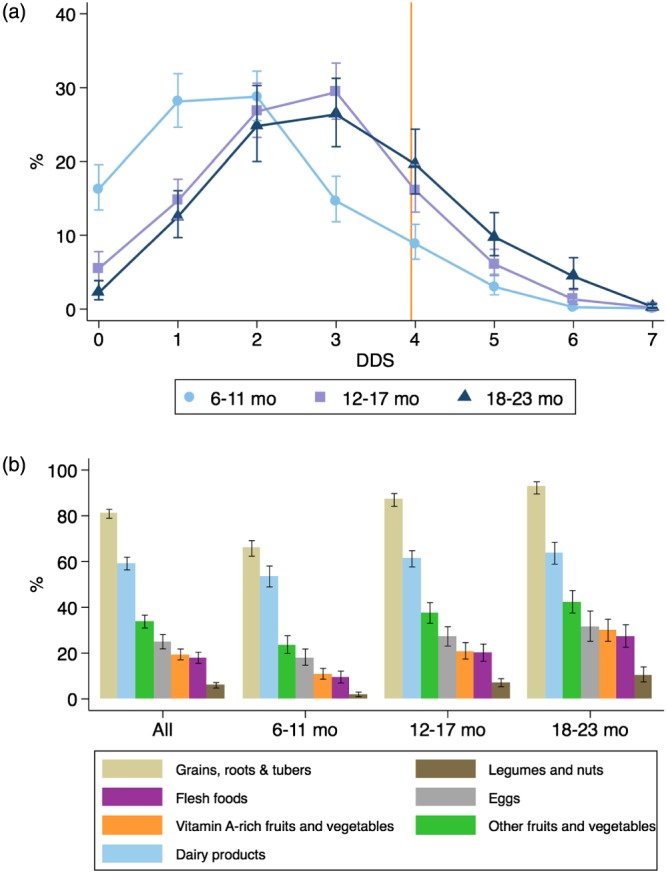
Patterns of food group consumption by child age group. (a) Proportion of children consuming different number of food groups and (b) proportion of food group consumption by child age. The orange vertical line indicates the minimum required four food groups per WHO's recommendation. Error bars are the lower and upper 95% confidence bounds of the proportion. DDS = dietary diversity score