Figure 2.
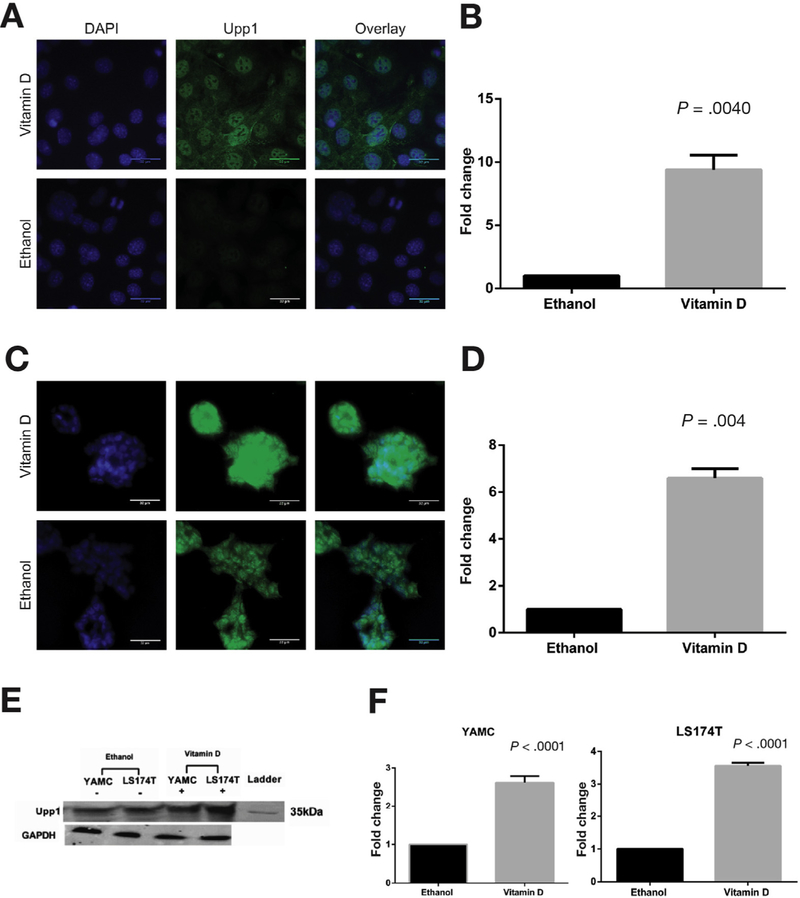
Vitamin D induction of Upp1 protein expression. Immunocytochemistry was performed in (A and B) YAMC and (C and D) LS174T cells after 24 hours of treatment with 1α,25(OH)2D3 or ethanol. Representative images are shown of (A) YAMC and (C) LS174T cells treated with 1α,25(OH)2D3 and ethanol. The columns are nuclear DAPI staining (blue), Upp1 staining (green), and the overlay of DAPI and Upp1. For LS174T cells, maximum intensity projections were used to depict the 3-dimensional structure. Scale bars indicate 32 µm. Localization of Upp1 protein was observed in both cytosol and nucleus in YAMC and LS174T cells. Quantitated mean gray values of Upp1 expression in 1α,25(OH)2D3-treated cells were normalized to ethanol and compared using Wilcoxon signed-rank test. Significant Upp1 up-regulation was observed in (B) YAMC (P =.004) and (D) LS174T (P =.004) cells. (E) Western blot confirms Upp1 protein expression at the expected mass of 34 kDa in YAMC and LS174T cells after 24 hours of treatment with ethanol and vitamin D. GAPDH was the loading control. (F) These results were quantitated. In YAMC cells, there was a significant 2.62-fold up-regulation of Upp1 with vitamin D treatment (P < .001), and in LS174T cells, there was a significant 3.56-fold up-regulation of Upp1 (P < .001). DAPI, 4′,6-diamidino-2-phenylindole; GAPDH, glyceraldehyde-3-phosphate dehydrogenase (phosphorylating).

