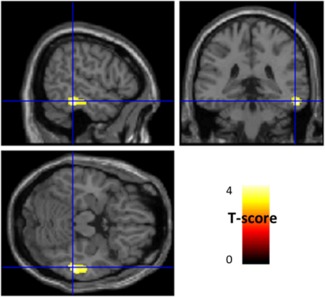
Figure 1.

Anatomical localization of areas of increased metabolism in ICD patients in comparison to without ICDs (p < .005, uncorrected, k > 130) projected onto sections of a normal MRI set spatially normalized and smoothed into the standard SPM8 template. In comparison to patients without ICDs, those with ICDs showed a relative increased metabolism in right middle and inferior temporal gyri (BA20–21). ICD: impulse control disorders; MRI: magnetic resonance imaging; BA: Brodmann area [Color figure can be viewed at http://wileyonlinelibrary.com]
