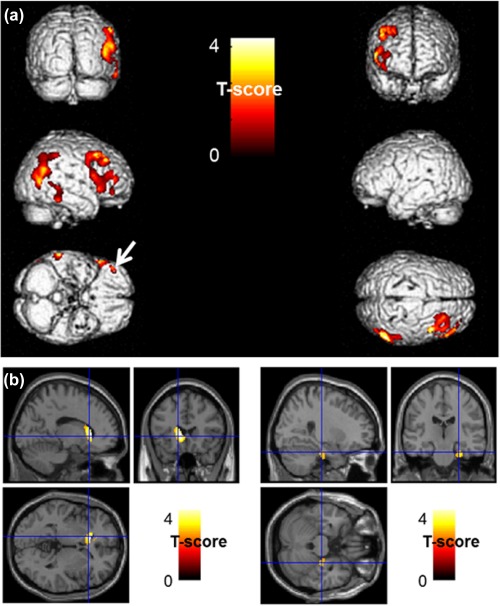
Figure 3.

Anatomical localization of areas of increased positive (upper panel in a) and negative (lower panel in b) right BA20–21 connectivity in ICD patients in comparison to those without ICDs (p < .005, uncorrected, k > 130) projected onto 3D volume rendering (a) and sections of a normal MRI (b) set spatially normalized and smoothed into the standard SPM8 template. ICD patients showed an increased positive connectivity in right middle temporal gyrus (BA20–21‐22), right middle and superior temporal gyri and parietal inferior lobule (BA37–39‐40) and right middle and inferior frontal gyri (BA9–10), including the orbito‐frontal area (BA11) (white arrow) (a). Moreover, ICD patients showed an increase negative connectivity with the left caudate (left panel), and with the right parahippocampal gyrus (BA35–36, right panel) (b). BA: Brodmann area; ICD: impulse control disorder; MRI: magnetic resonance imaging [Color figure can be viewed at http://wileyonlinelibrary.com]
