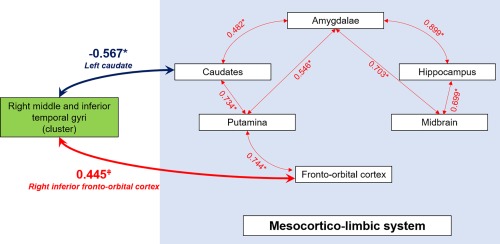
Figure 4.

Correlations graph in patients with ICD between right middle and inferior temporal gyri (BA20–21) and the mesocorticolimbic system. Spearman correlation coefficients are indicated on the Figure. In patients with ICD, right middle and inferior temporal gyri (BA20–21) exhibit decreased connectivity with the left caudate, and a trend for increased connectivity with the right inferior fronto‐orbital cortex. *p < .05, ǂp = .06 [Color figure can be viewed at http://wileyonlinelibrary.com]
