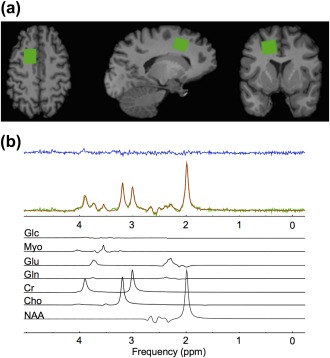
Figure 1.

(a) From left to right; axial, sagittal, and coronal views of a T1‐weighted anatomical image with the spectroscopy voxel overlaid in green in the prefrontal region. (b) Spectrum acquired (green) from the voxel in (a), reconstructed spectrum (red), the residual after fitting (blue), and the individual prior knowledge components of the spectrum shown below in black. Glc, Glucose; Myo, Myo‐inositol; Glu, Glutamate; Gln, Glutamine; Cr, Creatine; Cho, Choline; NAA, N‐acetyl aspartate; ppm, parts per million
