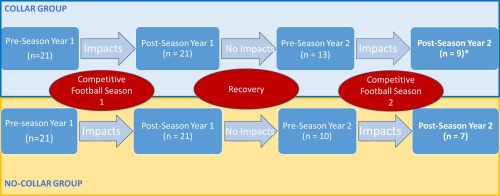
Figure 1.

Flow chart of study participant sampling over the 4 study time points. * Two of the 9 athletes in the collar group were not included in the analysis for Season 1. They were recruited at Season 2 and added in the pre‐ to postseason comparison for Season 2 to improve power in data analysis. [Color figure can be viewed at http://wileyonlinelibrary.com]
