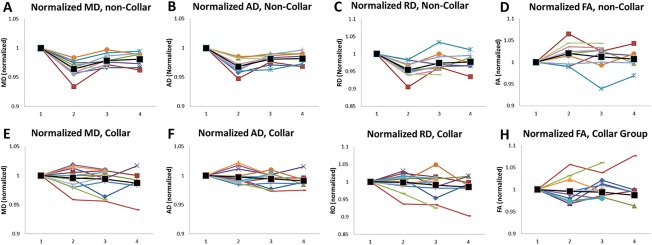
Figure 5.

Trajectories of the normalized DTI measures in WM over the four time points. Individual participants were represented in different colors. The black markers and lines are the average for all the participants. DTI values were extracted from the WM regions that showed significant DTI changes in the noncollar group in Season 1. DTI values are normalized with respect to the value at Time 1 (preseason of Season 1). The numbers 1–4 along the x‐axis denote the four time points. A–D: normalized MD, AD, RD, and FA respectively, in the noncollar group; E–H: normalized MD, AD, RD, and FA, respectively, in the collar group. [Color figure can be viewed at http://wileyonlinelibrary.com]
