
Figure 2.
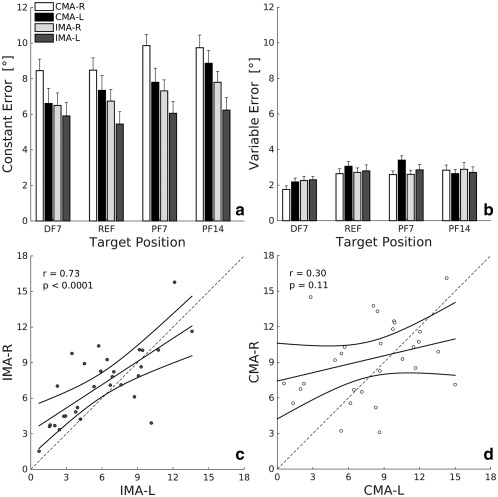
(a,b) Constant error (CE) and variable error (VE) for the four target angular positions (DF7, REF, PF14, and PF7) presented during the matching tasks. Error bars represent the standard error (mean ± SE). (c,d) The scatterplots show the CE during IMA‐L versus IMA‐R (left panel) and CMA‐R versus CMA‐L (right panel), respectively. The black solid lines are regression lines with their 95% confidence interval. The dotted gray lines indicate equal performance in the two conditions