
Figure 3.
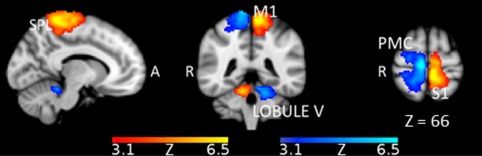
Clusters of neural activity (cluster corrected, Z ≥ 3.1, p < .0001) rendered on a standard MNI T1 template for the comparisons IMA‐R > IMA‐L (red‐yellow) and IMA‐L > IMA‐R (blue) for lower limbs position sense. SPL (superior parietal lobe), M1 (primary motor cortex), PMC (premotor cortex), S1 (primary somatosensory cortex), lobule V of the cerebellum. Activation areas highlighted a mirror symmetric pattern with respect to the brain midline. Sagittal view represents left hemisphere