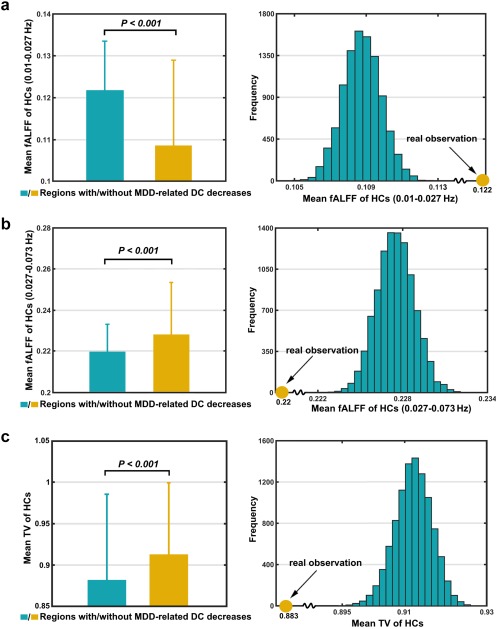
Figure 6.

Temporal characteristics of regions showing MDD‐related DC decreases. Relative to other areas in the brain, the regions showing MDD‐related FC decreases had significantly higher fALFF within 0.01–0.027 Hz (a), lower fALFF within 0.027–0.073 Hz (b), and less TV (c) in terms of the corresponding mean maps of the HCs (Figure 5) [Color figure can be viewed at http://wileyonlinelibrary.com]
