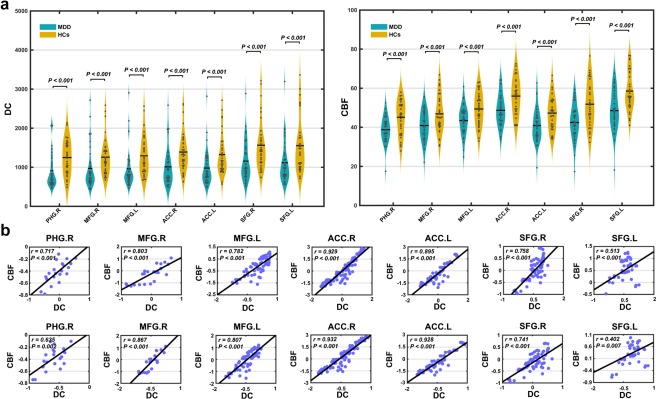
Figure 7.

Regional cross‐modality relationship. (a) For each region showing MDD‐related DC decreases, significantly reduced CBF was observed in the MDD patients compared with the HCs. (b) Group‐level across‐voxel correlation analyses further revealed significantly positive correlations between the DC and CBF within each of the regions for both the HCs (first row) and MDD (second row) groups [Color figure can be viewed at http://wileyonlinelibrary.com]
