Figure 9.

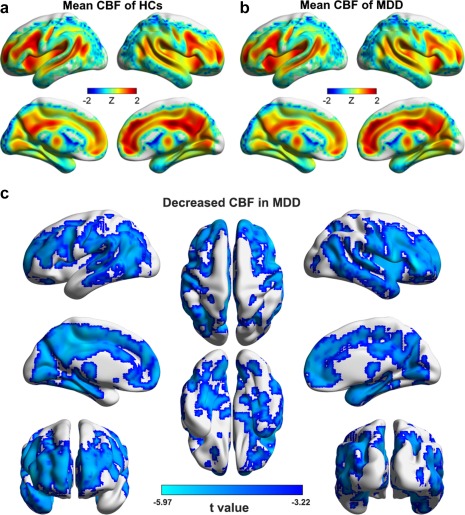
CBF maps of within‐group means (a and b) and between‐group differences (c). Widespread CBF decreases were observed in patients with MDD in both cortical and subcortical regions [Color figure can be viewed at http://wileyonlinelibrary.com]

CBF maps of within‐group means (a and b) and between‐group differences (c). Widespread CBF decreases were observed in patients with MDD in both cortical and subcortical regions [Color figure can be viewed at http://wileyonlinelibrary.com]