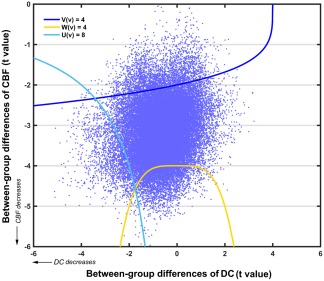
Figure 10.

A scatter plot of the t values derived from the between‐group comparisons of whole‐brain DC and CBF. The cluster defining thresholds for the concordance and dissociation combining functions are also presented [Color figure can be viewed at http://wileyonlinelibrary.com]
