
Figure 12.
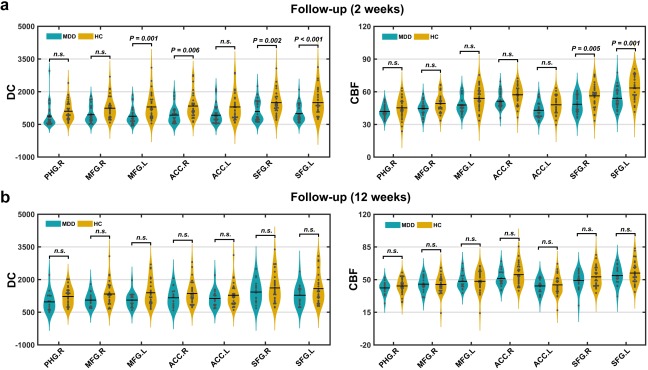
Between‐group differences in DC and CBF after follow‐up. (a) Out of the 7 regions showing MDD‐related FC decreases at baseline, 3 and 5 were normalized after 2‐week medication in terms of DC and CBF. (b) After 12‐week antidepressant treatment, no regions were found to show between‐group differences in either DC or CBF [Color figure can be viewed at http://wileyonlinelibrary.com]