
Figure 2.
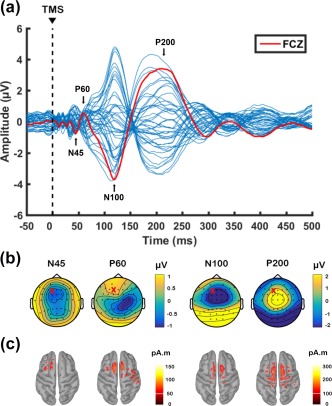
Transcranial magnetic stimulation (TMS)‐evoked potentials following single‐pulse stimulation over left prefrontal cortex (F1 electrode) before theta‐burst stimulation (data combined across conditions at baseline). (a) Butterfly plot of all electrodes with peaks of interest (N45, P60, N100, P200) shown in text. The red line indicates the waveform obtained from FCz electrode for graphical representation. (b) Voltage distribution and (c) Minimum Norm Estimates (MNEs) of the source level activity at the cortex for each peak of interest. ‘X’ on topoplots represents stimulation site