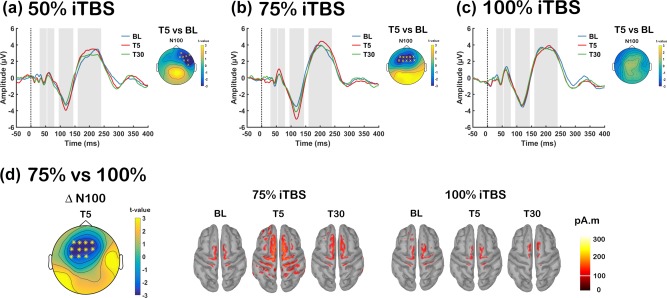
Figure 3.

Assessment of transcranial magnetic stimulation (TMS)‐evoked potentials (TEPs) before and after each stimulation condition [a: Intermittent theta‐burst stimulation (iTBS) at 50% rMT (50% iTBS); b: iTBS at 75% rMT (75% iTBS); c: iTBS at 100% rMT (100% iTBS)]. Grand average TEP waveforms before (BL: blue), 5‐min post (T5: red) and 30‐min post (T30: green) iTBS at FCz electrode for each stimulation conditions, with significant differences across the scalp illustrated in topoplots. (d) Global scalp differences of iTBS‐induced change in N100 amplitude (TEP Δ N100) between 75% and 100% iTBS at T5 and Minimum Norm Estimates (MNEs) of the source level activity at the cortex for the N100 peak. Asterisks and ‘X’ s on topoplots indicate significant clusters between comparisons (cluster‐based statistics, *p < .01, X p < .025) [Color figure can be viewed at http://wileyonlinelibrary.com]
