
Figure 5.
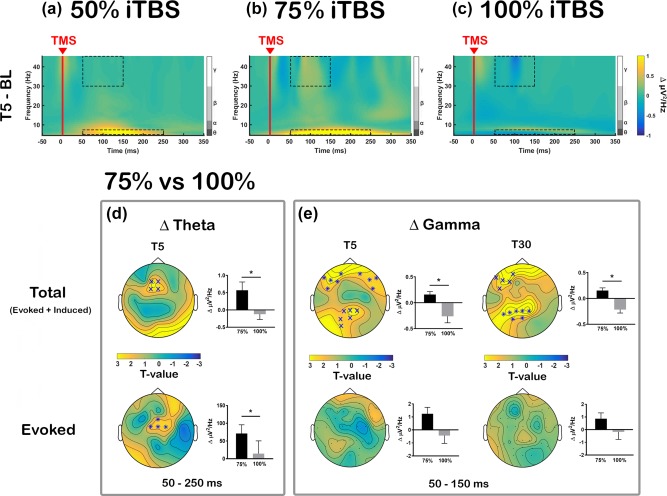
Comparison of transcranial magnetic stimulation (TMS)‐evoked oscillations in iTBS‐induced changes [a: Intermittent theta‐burst stimulation (iTBS) at 50% rMT (50% iTBS); b: iTBS at 75% rMT (75% iTBS); c: iTBS at 100% rMT (100% iTBS)]. Grand average time‐frequency plots are illustrated using average of all electrodes and displayed the difference between baseline and T5 (Δ power; T5 – BL). Dotted boxes represent time‐frequency windows for gamma (50–150 ms) and theta (50–250 ms) bands where statistical analyses were conducted. Comparison between 75% and 100% iTBS conditions in (d) Δ theta at T5 and (E) Δ gamma at T5 and T30 across the scalp. Both total power (evoked + induced; top row) and evoked power alone (bottom row) were examined separately. Asterisks and ‘X’ s on topoplots indicate significant clusters between comparisons (cluster‐based statistics, *p < .01, X p < .025). Bar graphs were plotted using the values extracted from the significant sensors (when not significant, using same sensors as total power) to examine the directional changes [Color figure can be viewed at http://wileyonlinelibrary.com]