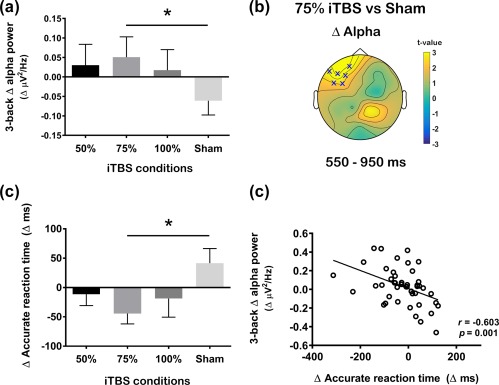
Figure 10.

Comparison of the change (Δ) in alpha power between different stimulation condition during the 3‐back task and its association to working memory performance. (a) Comparison of global scalp Δ alpha power between 50%, 75%, 100% and sham intermittent theta burst stimulation (iTBS) and (b) scalp map representing t‐values for the significant differences (cluster‐based statistics, Xp < .025). (c) Comparison of Δ accurate reaction time between different stimulation condition and (D) correlation between Δ alpha power and Δ accurate reaction time following active iTBS. Error bars indicate standard error of means (SEM) [Color figure can be viewed at http://wileyonlinelibrary.com]
