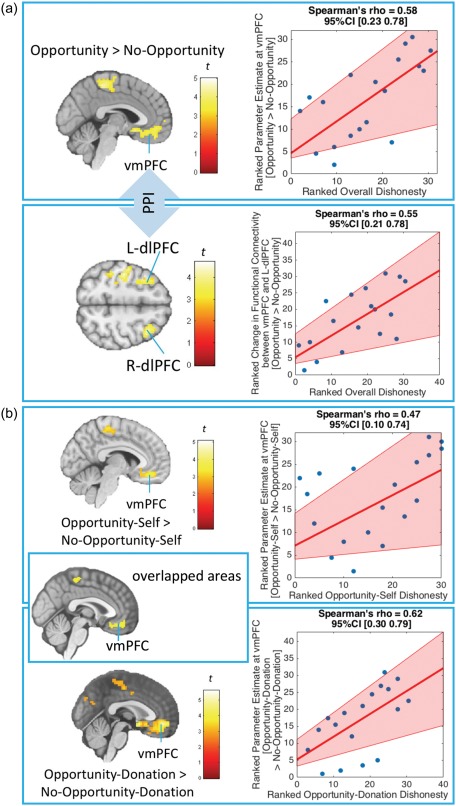
Figure 3.

Neural activity of the Opportunity vs. No‐Opportunity effects as a function of ranked Overall Dishonesty, Opportunity‐Self Dishonesty and Opportunity‐Donation Dishonesty. Figure 3a shows neural activity of the Opportunity vs. No‐Opportunity effects across both Self and Donation trials as a function of ranked Overall Dishonesty. Overall Dishonesty is defined by total self‐reported % accuracy across both Opportunity‐Self and Opportunity‐Donation trials. The top section shows a positive relationship between Overall Dishonesty and neural activity in the ventromedial prefrontal cortex (vmPFC) when participants had an opportunity to over‐report accuracy [Opportunity > No‐Opportunity]. The bottom section shows a positive relationship between Overall Dishonesty and the functional connectivity between the vmPFC and bilateral dorsolateral prefrontal cortex (dlPFC). The functional‐connectivity analysis was conducted using a PPI between Opportunity and No‐Opportunity conditions collapsing across Self and Donation trials with the vmPFC [3 57 −6] as a seed. Figure 3b shows neural activity of the Opportunity vs. No‐Opportunity effects separately for Self and Donation trials as a function of ranked Opportunity‐Self Dishonesty and Opportunity‐Donation Dishonesty, respectively. Opportunity‐Self Dishonesty and Opportunity‐Donation Dishonesty are defined by self‐reported % accuracy in Opportunity‐Self and Opportunity‐Donation trials, respectively. This figure shows positive relationships between self‐reported % accuracy and neural activity in the ventromedial prefrontal cortex (vmPFC) when participants had an opportunity to over‐report accuracy in both Self [Opportunity‐Self Dishonesty and Opportunity‐Self > No‐Opportunity‐Self contrasts] and Donation [Opportunity‐Donation Dishonesty and Opportunity‐Donation > No‐Opportunity‐Donation contrasts] trials. The images were based on whole‐brain regression analyses [Cluster‐forming threshold at p <.005, cluster‐wise corrected (pFWE <.05)]. The pink shaded area in the rank‐transformed scatterplot (higher value = higher rank) represents bootstrapped 95% CIs around the linear regression line (Pernet, Wilcox, and Rousselet, 2013) [Color figure can be viewed at http://wileyonlinelibrary.com]
