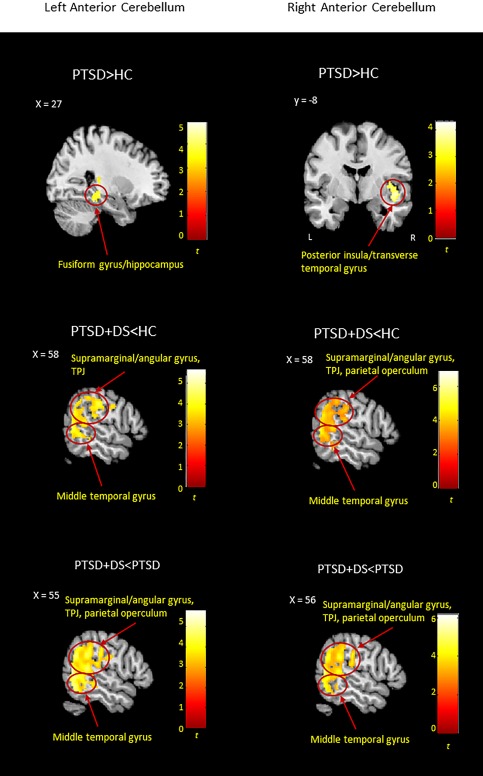
Figure 2.

Between‐group resting‐state functional connectivity results emerged for the left and right anterior cerebellum (lobules IV–V). Results are shown at a cluster extent threshold ensuring whole‐brain correction at α < .05. CNTR: control group; PTSD: posttraumatic stress disorder group; PTSD + DS: dissociative subtype of PTSD group; >: increased functional connectivity; <: decreased functional connectivity [Color figure can be viewed at http://wileyonlinelibrary.com]
