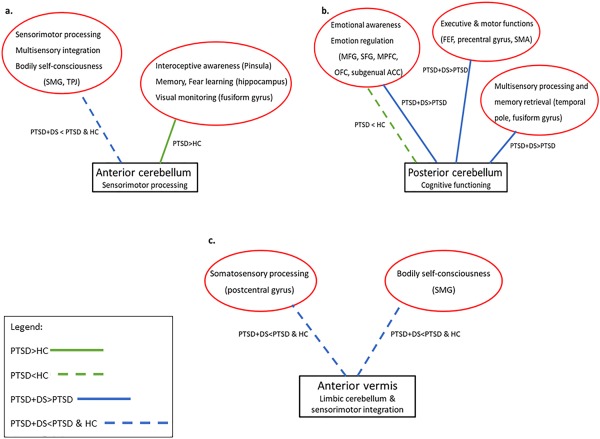
Figure 5.

Cerebellar functional connectivity in PTSD and its dissociative subtype. Diagrams synthesize the results of the between‐group comparisons of the functional connectivity of (a) the anterior cerebellum (lobules IV–V); (b) the posterior cerebellum (Crus I); and (c) the anterior vermis. Whereas the solid green line represents increased functional connectivity between cerebellar and cortical regions in PTSD as compared to controls, the dotted green line represents decreased functional connectivity between cerebellar and cortical regions in PTSD as compared to controls. Whereas solid blue lines refer to the increased functional connectivity between cerebellar and cortical regions in PTSD + DS as compared to PTSD, dotted blue lines refer to decreased functional connectivity between cerebellar and cortical regions in the PTSD + DS group as compared to the PTSD and the control groups. Red circles report cortical regions and their functions according to our model. ACC: anterior cingulate cortex; FEF: frontal eye field; HC: healthy controls; MFG: middle frontal gyrus; MPFC: medial prefrontal cortex; OFC: orbito‐frontal cortex; PTSD: posttraumatic stress disorder group; PTSD+DS: dissociative subtype of PTSD; SFG: superior frontal gyrus; SMA: supplementary motor cortex; SMG: supramarginal gyrus; TPJ: temporo‐parietal junction [Color figure can be viewed at http://wileyonlinelibrary.com]
