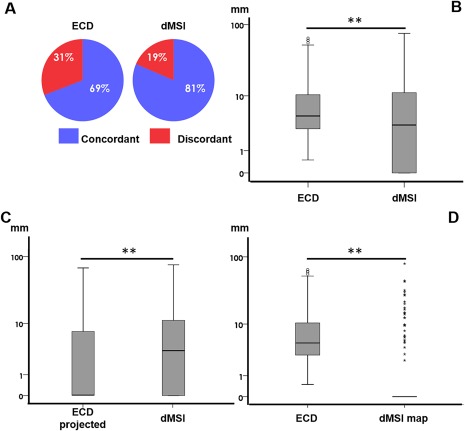
Figure 2.

Source localization in comparison with the epileptic focus. Panel A. Concordance at sublobar level versus epileptic focus. Panel B. Boxplot distribution of Dmin comparing ECD and dMSI. The minimum distance was significantly lower for dMSI. The median difference between dMSI and ECD was in the range of few millimeters. The median Dmin of the dipole projection to the closest cortical point was significantly lower than dMSI Dmin (Panel C). However, when taking into account that dMSI recovers a cortical region (cMEM map thresholded at 30% of its maximum amplitude, Dmin became significantly smaller (Panel D). Note that Dmin values along the y axis are in logarithmic scale. [Color figure can be viewed at http://wileyonlinelibrary.com]
