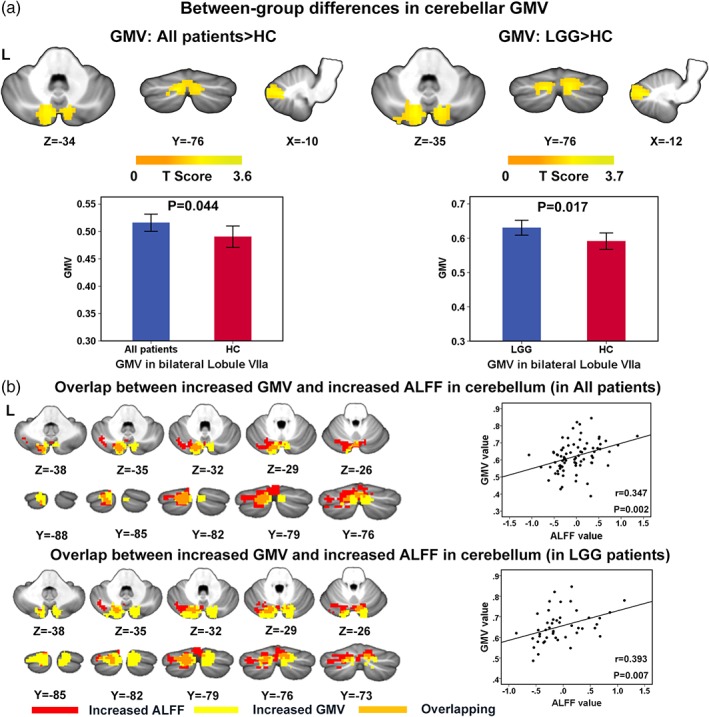
Figure 3.

Between‐group differences in cerebellar GMV and overlap between increased GMV and increased ALFF. (a) Between‐group comparison showed that the GMV in the bilateral lobule VIIa is greater in all patients as compared with HCs (left), and also in LGG patients compared with HCs (right). Color‐bars denote the T value (permutation test, p < .01 in voxel level and <0.05 in cluster level, FWE corrected). The lower row demonstrates the comparison of GMV (mean value) within the cluster in which between‐group differences in GMV were observed. The error bars represent standard deviations. (b) Overlap map between regions with increased GMV and increased ALFF, the maps of all patients and LGG patients are shown separately. The scatter plots in the right column of each row demonstrate the correlation between mean ALFF value and mean GMV value in the overlapping region. GMV, gray matter volume; ALFF, amplitude of low‐frequency fluctuation [Color figure can be viewed at http://wileyonlinelibrary.com]
