
Figure 1.
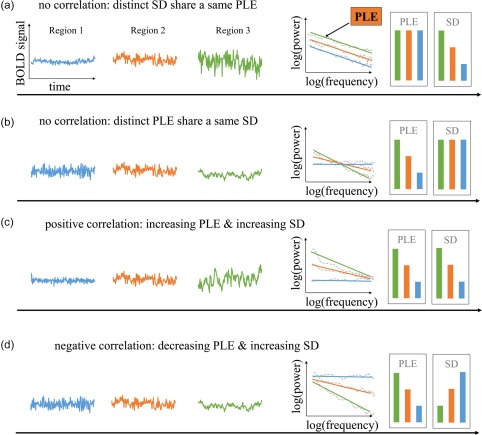
Schematic illustration of two temporal features across brain regions: the LRTCs (measured by power‐law exponent (PLE)) and the temporal variability (measured by standard deviation (SD)) and their possible relationships. Left three columns represent the time course from three different regions. The fourth column describes the power spectrum of the time courses in log scale. Dashed line indicates their power in frequency and the solid line indicates the fitting line. The slope is defined as power‐law exponent. The two right columns illustrate the value of PLE and SD for each region. Four possible relationships are presented here: (a) SD is independent of PLE, distinct SD share a same PLE. (b) Or conversely, distinct PLE share a same SD. (c) They positively correlate with each other: the higher PLE, the higher variability. (d)They negatively correlate with each other [Color figure can be viewed at http://wileyonlinelibrary.com]