
Figure 3.
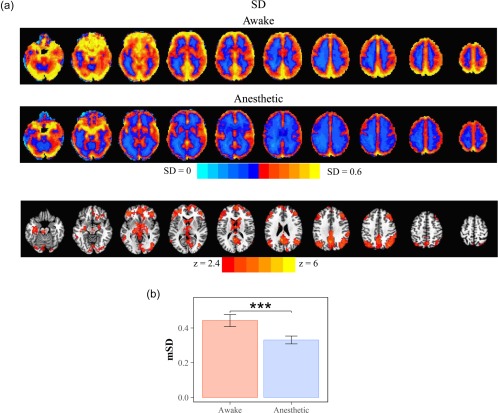
Reduced SD in propofol‐induced anesthetic state. (a) Spatial maps of SD in awake (top) and anesthetic (middle) state. Voxel‐wise group comparison of the SD showed significant decrease in wide‐spread brain regions (threshold at p < .01) (bottom). (b) Group comparison of mean of SD (mSD) [Color figure can be viewed at http://wileyonlinelibrary.com]