
Figure 4.
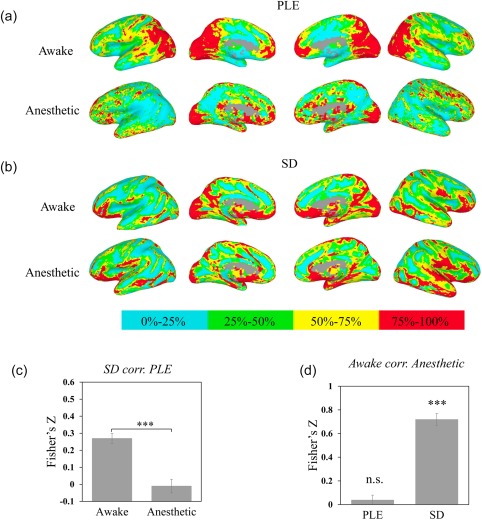
Spatial pattern across awake and propofol‐induced anesthetic state for PLE and SD. Values were ranked and converted into four percentage bins (indicated by color bar) to visualize spatial pattern of PLE and SD. (a) Spatial maps of PLE in awake (top) and anesthetic (bottom). (b) Spatial maps of SD in awake (top) and anesthetic (bottom). (c) Comparison of correlation between PLE and SD in awake and anesthetic state revealed the PLE and SD decoupled in anesthetic state. The correlation was calculated for each subject first with Fisher's Z transformation, and performed in group level with paired t test. (d) Whole‐brain voxel‐based correlation between awake and anesthetic for PLE, SD. The results of spatial correlations indicated the spatial pattern of PLE was more disrupted in anesthetic state when compared to the spatial patterns of SD. *p < .05, **p < .01, ***p < .005 [Color figure can be viewed at http://wileyonlinelibrary.com]