
Figure 6.
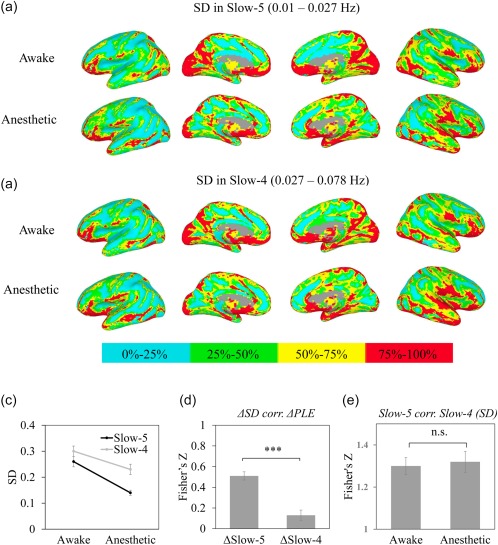
Spatial pattern across awake and propofol‐induced anesthetic state for PLE and SD in Slow‐5 (a) and Slow‐4 (b). Values were ranked and converted into four percentage bins (indicated by color bar) to visualize spatial pattern of SD in Slow‐5 and Slow‐4. (c) ANOVA analysis revealed mean effects of state and frequency, as well as its interaction effect, which confirmed a frequency specificity of SD. (d) Correlation between the difference of PLE ( PLE) and the difference of SD ( SD) in Slow‐5 ( Slow‐5) and Slow‐4 ( Slow‐4). The reduction of PLE correlated more with reduction of Slow‐5. (e) Correlation between SD in Slow‐5 and Slow‐4 in awake and anesthetic state. The high correlation coefficients and no difference between awake and anesthetic state suggested a state independent relationship between Slow‐5 and Slow‐4. *p < .05, **p < .01, ***P < .005 [Color figure can be viewed at http://wileyonlinelibrary.com]