
Figure 7.
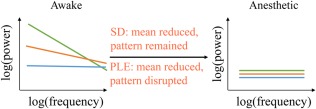
Schematic illustrations of how the PLE and SD reduced in anesthetic. In awake state, regions with higher SD reveal higher PLE. SD reduces with pattern unchanged while PLE reduces and becomes homogeneous across the whole brain [Color figure can be viewed at http://wileyonlinelibrary.com]