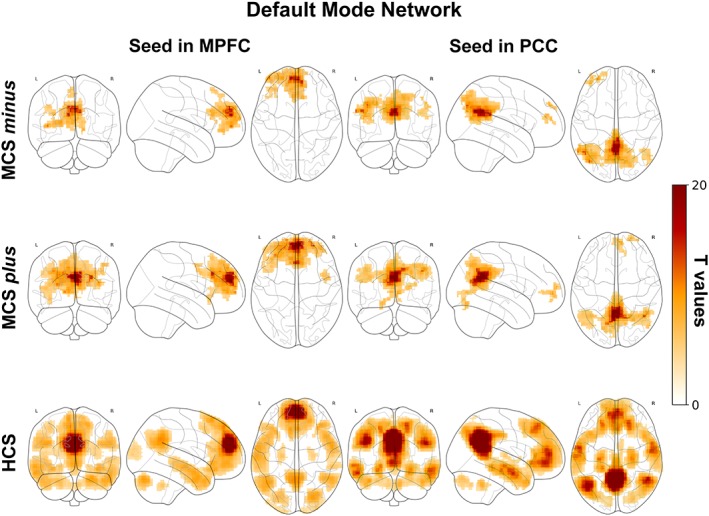
Figure 4.

Correlation between the MPFC (left column), PCC (right column) and the time series from all other brain voxels in MCS minus (upper row), MCS plus (middle row) and HCS (bottom row). Statistical maps are thresholded at p < .05 family wise error corrected at cluster level, with clusters made of voxels surviving a p < .001 (whole‐brain level) and are rendered on the midline and lateral surfaces of a single subject's MRI template. The color bar indicates T values. This figure was displayed in neurological convention. MPFC: Medial prefrontal cortex, PCC: Posterior cingulate cortex, MCS: Minimally conscious state, HCS: Healthy control subjects [Color figure can be viewed at http://wileyonlinelibrary.com]
