
Figure 1.
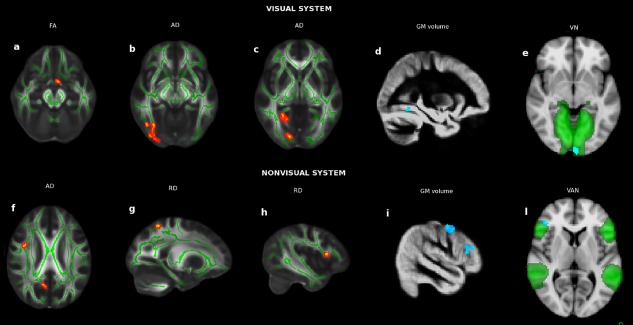
Voxelwise abnormalities in NTG compared with NC at the level of visual (upper panel) and nonvisual (lower panel) system in terms of AC (a–c, f–h; in red the clusters of decreased FA, increased AD/RD; green is the WM skeleton), GM volumes (d, i; in blu‐light blu the clusters of GM atrophy) and FC [e, l; in blu‐light blu the clusters of changes in FC, which was decreased in VN (green) and increased in VAN (green)]. See Results section for details. [Color figure can be viewed at http://wileyonlinelibrary.com]