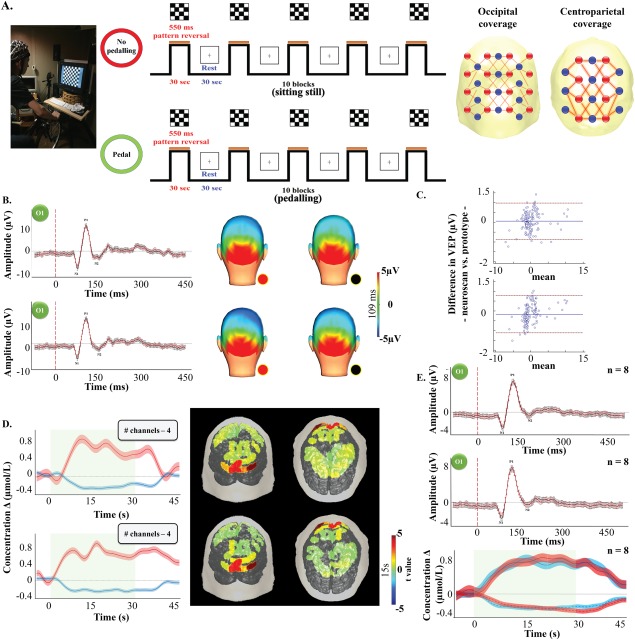
Figure 3.

Channel layout and description of the visual paradigm (A). P100 time course and topography over the visual cortex averaged along every stimulation blocks while sitting still (upper row) and pedaling (bottom row) for participant B4. Black line/dot: Neuroscan system. Red line/dot: fNIRS‐EEG prototype (B). Results from the Bland–Altman analysis for the P100 amplitude changes at rest (left) and while pedaling (right) between our prototype and Neuroscan. Doted red line: limits of agreement. Solid blue line: bias (C). Δ[HbO2] (red line)/Δ[Hb] (blue line) time courses over the visual cortex and Δ[HbO2] topography (15 s), with color‐coded t value after Bonferroni‐correction for multiple comparison (P < 0.0004), averaged over 8 visual stimulation periods in subject B4 obtained from 5 channels over the visual cortex while sitting still (upper row) and pedaling (bottom row). Red and blue shaded area: standard error of the mean for Δ[HbO2] and Δ[Hb], respectively. Green shaded area: stimulation period (D). Average P100 time course from all 8 participants obtained with our system (solid red line) and the Neuroscan system (solid black line) while sitting still (first row) and pedalling (second row) (E).
