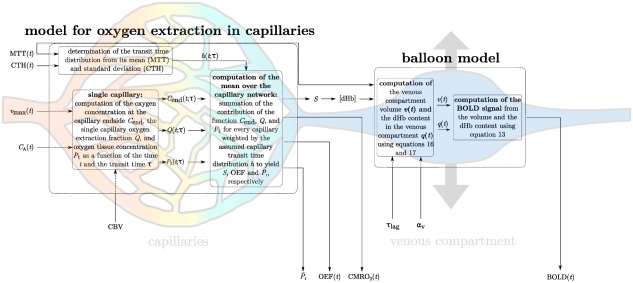
Figure 1.

Schematic illustrating the procedure for computing the BOLD signal, given the time courses of MTT, CTH, and . In the first step, the deoxyhemoglobin concentration at the capillary end is computed. In the second step, the venous compartment volume is computed from . The BOLD signal is finally computed from the deoxyhemoglobin concentration and venous compartment volume. Abbreviations: CMRO2, cerebral metabolic rate of oxygen; CTH, capillary transit time heterogeneity; MTT, mean transit time; OEF, oxygen extraction fraction; , mean oxygen concentration in the tissue; S, oxygen saturation; , maximum metabolic rate of oxygen; please refer to Table 1 for other variables [Color figure can be viewed at http://wileyonlinelibrary.com]
