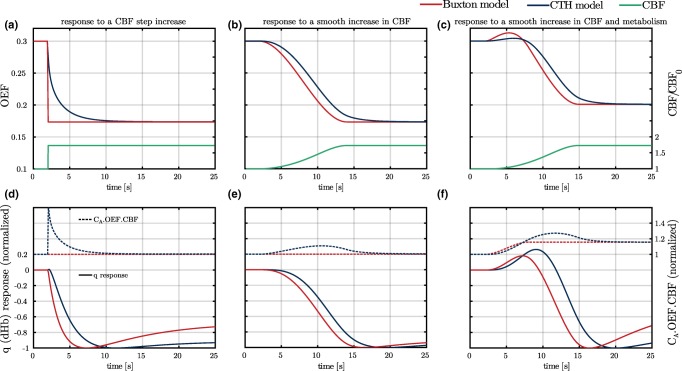
Figure 2.

(a–c) OEF responses to different CBF (green curves) increases using the model used in Buxton et al. (2004, 1998) (Buxton model, red curves) and our model (CTH model, blue curves). In panels a and b, the metabolism is assumed to be constant, while it increases by 15% in panel c 900 ms prior to the increase in CBF. (d–f): q (deoxyhemoglobin) responses (plain lines) and time courses of the quantity (dashed lines) are shown under same conditions as panels (a–c). When using CTH model, to visualize the sole effect of CBF on oxygen extraction from the plasma, oxygen metabolism is assumed to be saturated, that is, the value of the parameter is smaller (0.001 mmHg) than elsewhere in the article. Abbreviations: CBF, cerebral blood flow; OEF, oxygen extraction fraction [Color figure can be viewed at http://wileyonlinelibrary.com]
